Mixpanel vs Amplitude : which tool to choose ?

Table of contents
Over the past decade, Amplitude and Mixpanel have emerged as essential analytics platforms for Product Managers. Their popularity stems from their ability to transform vast amounts of data into actionable insights. Unlike the standard Google Analytics, they offer a value proposition focused on results.
If you're struggling to extract meaningful information from your GA reports to optimize your app, website, or SaaS service, these tools are the ideal solution for you!
Mixpanel vs Amplitude: key differences
Unsure about which solution to choose? It's a tough decision since both services have drawn inspiration from each other over the years. Having worked on projects using both solutions during my tenure as a Product Owner at Betomorrow, I've noticed the following differences.
Learning curve and Accessibility
Amplitude provides in-depth data analysis. If you're experienced in data analysis and already have a large volume of data to process, Amplitude is a relevant choice for you. However, if your current goal is to understand and validate your Product Market Fit or if you have limited time to dedicate to data analysis, Mixpanel will fit these constraints perfectly.
Focus on Product Marketing
The product teams at Mixpanel have continuously improved their interface, culminating recently in the Mixpanel Marketing Analytics feature. Designed as a comprehensive toolkit to simplify the lives of Product Marketing Managers, this new offering includes:
Dedicated marketing templates,
Complete journey analyses,
Cost-per-click analyses,
Acquisition channels.
With Mixpanel Marketing Analytics, Product Marketing Managers now have all the necessary tools to optimize their campaigns and gain valuable insights.
User behavior and Segmentation
Amplitude excels in its advanced capabilities for detailed user behavior and segmentation analysis. Among its features, session recording with replay is extremely useful for identifying bugs or understanding unexpected behaviors. The use of AI to generate predictive cohorts, along with various interfaces dedicated to comparing KPIs by cohort, allows users to go further than Mixpanel, provided they can invest enough time.
“Govern”: an innovation by Amplitude
Since acquiring the startup Iteratively, Amplitude has expanded its range of services. With "Govern", the tool now offers a tagging plan management module that allows real-time creation, editing, and cleaning of events on the platform: the ideal tool for maintaining impeccable data hygiene.

Mixpanel vs Amplitude: comparing the “Magic” features of both tools
“Find Interesting Segments”: Mixpanel's feature for discovering winning segments
Instead of spending time exploring various property breakdowns to find significant data, this feature automatically identifies them for you. Mixpanel examines the properties and cohorts of your events to indicate which segments have higher or lower than average conversion rates, making them statistically significant.
You will receive two reports via email: a segment analysis and a temporal comparison.

Discover Your “Aha Moment” with Mixpanel's “Signal” Feature
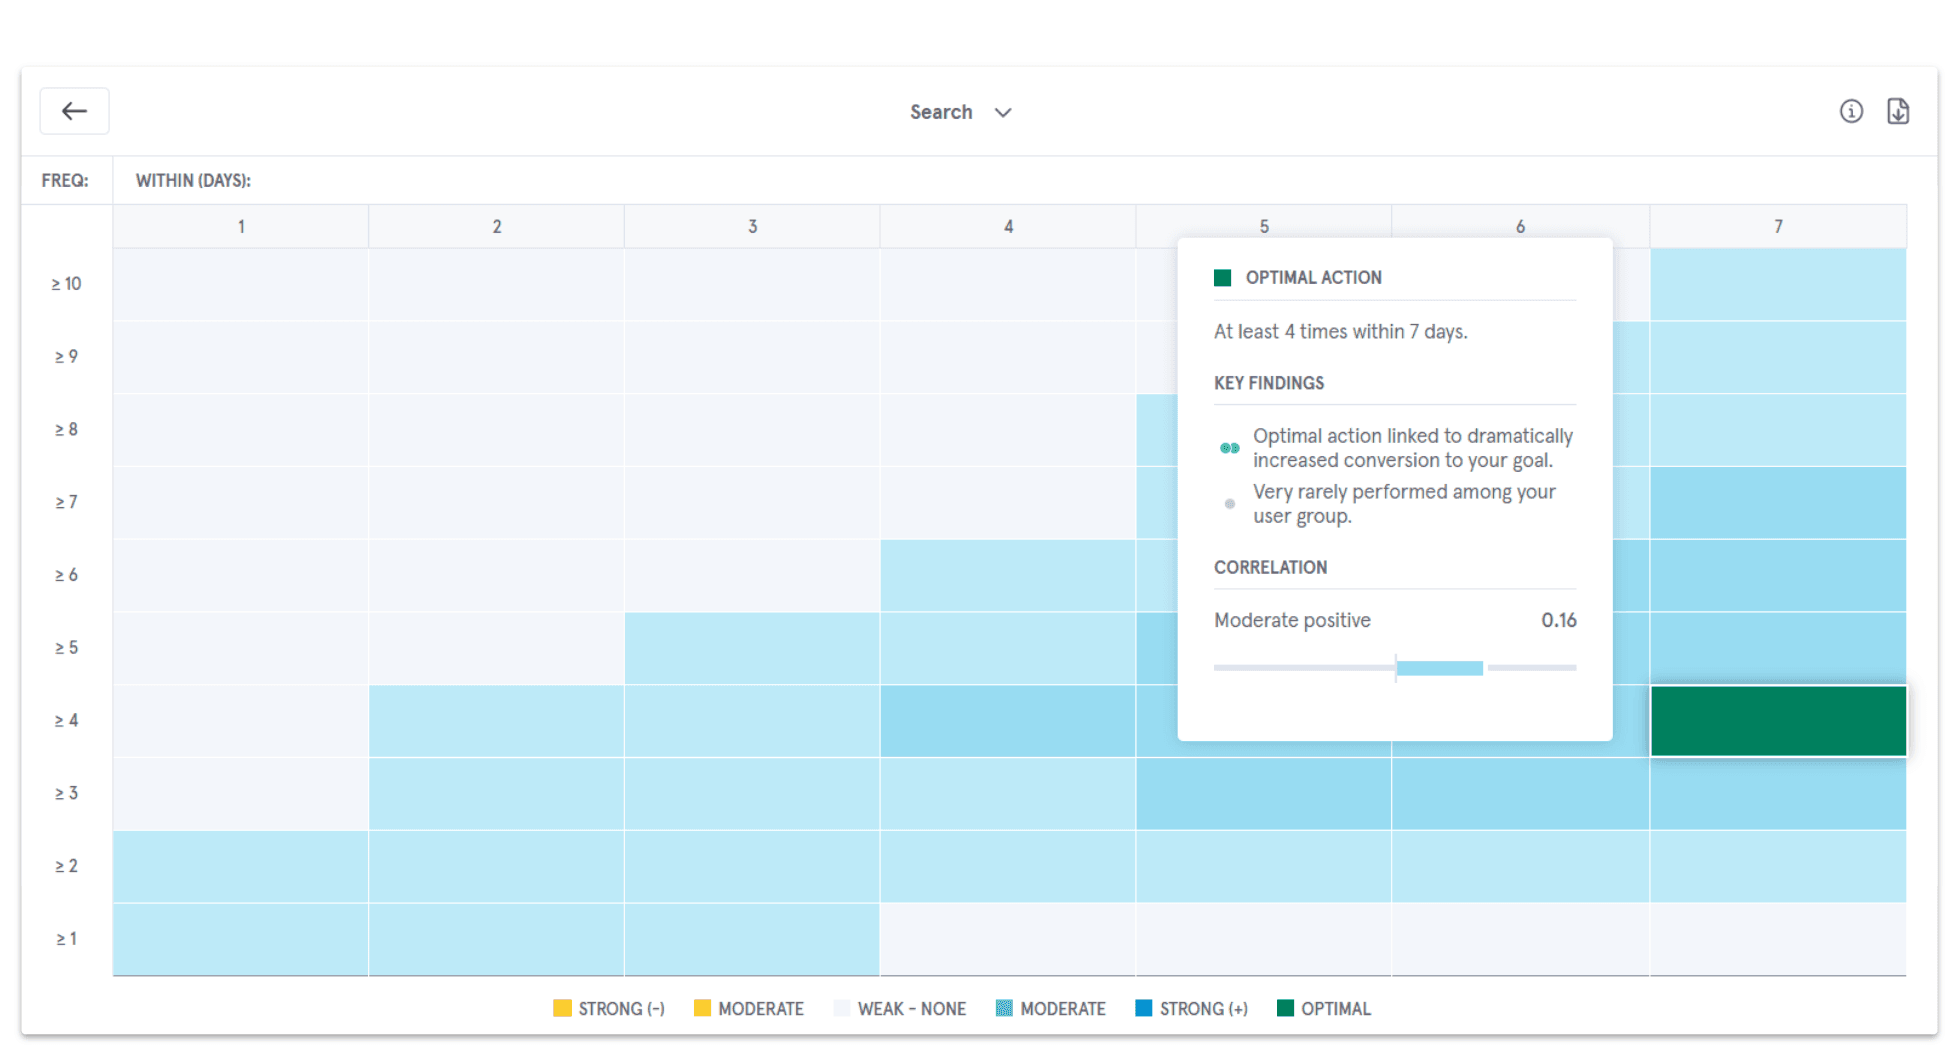
With Signal, Mixpanel’s correlation analysis tool, you can uncover your own "Aha moment"—the point at which users first perceive the added value of your product and the benefits it brings to their daily lives. Simply set a goal, such as second-week retention, and analyze the series of actions that typically lead to this outcome. Signal measures the association between a correlation event and a target event, quantifying their relationship. This provides a deep understanding of behaviors that drive customer conversions and can guide strategic decisions.
Let's take the example of a Fintech app. This app might want to understand the correlation between key events and users who subscribe to a financial service. Identifying the optimal actions users take before subscribing to a service is essential. To build this analysis in Signal, select the target users and determine how the target event “Service Subscription” correlates with key events. The correlation results are then provided. For instance, "Balance Check" might show a strong positive correlation with service subscription. Most users who checked their balance subsequently subscribed to the service.
This information can guide future product decisions. Knowing that users who check their balance are more likely to subscribe, you can develop tools to encourage this action, potentially leading to a significant increase in subscriptions. It is then crucial to track the progress of your metric. Mixpanel allows you to set this metric in the cohort builder and then create a time series in Insights to monitor its status at any time. This unique capability, compared to other product analytics solutions, also applies to other growth KPIs, such as retention and heavy usage.
Amplitude as a CDP: Event Streaming and Data Transmission to Third-Party Services
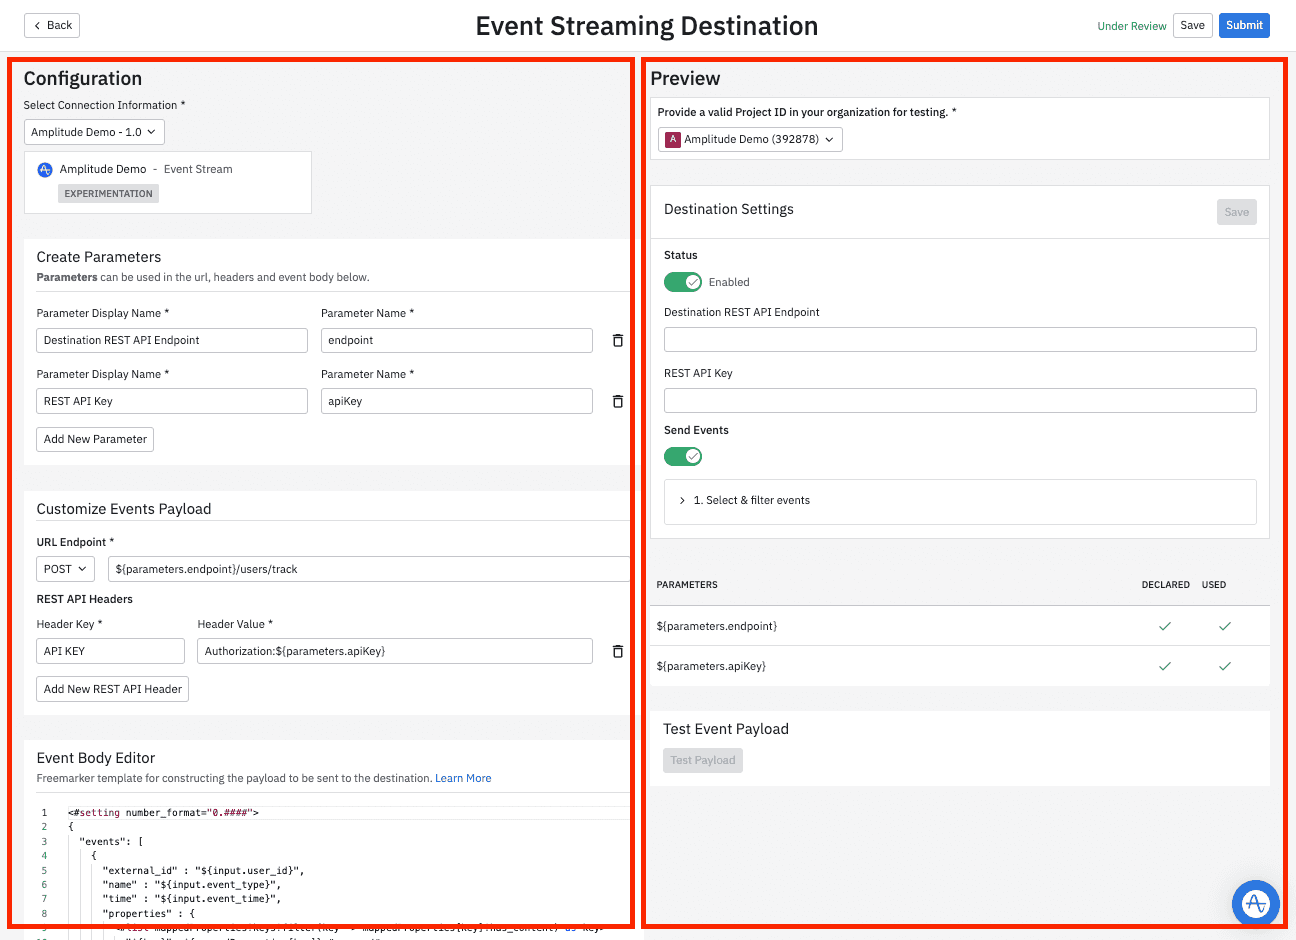
Event streaming in Amplitude enables you to share your behavioral data across your entire system. You can use this data to enrich customer profiles and send information to your marketing, sales, and infrastructure tools.
With this feature, you can:
Benefit from tools that provide precise control over the data being transmitted.
Filter by user, group, and event properties to ensure only relevant information is sent.
Monitor key metrics such as event volume, latency, and detailed delivery status to evaluate the performance and reliability of your integration.
Event streaming goes beyond simple cohort synchronization:
It simplifies your data setup, allowing you to use a single Amplitude configuration to send data to various platforms without constant technical adjustments.
It offers precise control over which events, users, or properties are sent to each platform, ensuring that only important data reaches its destination.
This integrated and flexible approach maximizes the value of collected data, providing a comprehensive and actionable view of user behaviors. This is essential for making informed and strategic product and marketing decisions.
Amplitude Offers Unreal SDK integration
If your company aims to develop games and incorporate analytics for detailed player insights, Amplitude offers a key feature to achieve this. The open-source SDK from Amplitude integrates with your application to transmit user behaviors and contexts to Amplitude, providing valuable data analytics.
This includes:
Event Tracking: records user actions and the completion of defined steps.
User Information: captures details such as app version, phone model, OS version, and carrier information to improve lead retention.
Revenue Tracking: optimizes advertising campaigns.
Unreal SDK is a software development company providing an innovative platform for creating virtual and augmented reality experiences. Their technology optimizes how developers build, deploy, and operate their applications, enabling the creation of immersive environments that push the boundaries of digital content. With a focus on realism, performance, and scalability, Unreal SDK helps businesses in various sectors explore new possibilities in gaming, architecture, design, film production, education, and training.
By using this SDK, developers can send event data to Amplitude, which can then be analyzed to gain insights into user behavior, application performance, and other key metrics for making data-driven decisions. The Amplitude Analytics SDK for Unreal Engine is currently in beta and supports projects targeting iOS, MacOS, or tvOS.
Mixpanel vs. Amplitude: pricing and plans comparison
Free plans
Amplitude and Mixpanel both offer free plans with basic features to test their products. These plans include:
Basic reports,
Unlimited user accounts,
A certain number of tracked events per month.
However, there are some key differences. Amplitude allows tracking up to 10 million events per month, which is sufficient for a growing business. In contrast, Mixpanel offers tracking for 100,000 users per month, with each user capable of generating up to 1,000 events, totaling 100 million events per month. However, the 1,000 events per user limit can quickly become a constraint. Thus, despite higher numbers, it raises the question of whether Mixpanel is the ideal solution if you plan to stay on the free plan long-term. It all depends on your needs and goals.
Paid plans
Mixpanel allows you to create a custom growth plan directly on their website by adjusting the number of monthly tracked users to avoid overages. If this number increases, the tool continues to function, with additional fees applied the following month. The base price of Mixpanel is $25 for 1,000 tracked users per year, or $36 if paid monthly. This plan includes:
Advanced analytics,
Unlimited data exports,
Email support.
However, the limit of 1,000 events per user and 100,000 tracked users remains, which can be restrictive despite a competitive rate. To remove all restrictions, the Enterprise plan is necessary, starting at around $2,000 per month.
The drawback of Amplitude is that it does not disclose the cost of its growth plan without contacting their sales team. According to some sources, the average price of Amplitude's “Growth” plan is around $1,500 per month, much higher than Mixpanel’s cap ($1,190 per month for 100,000 tracked users). This shows that Amplitude primarily targets mature businesses capable of spending more on analytics.
Amplitude’s Growth plan offers advanced behavioral analytics, customer support, and some additional features, with no limit on the number of tracked events per month. The Enterprise plan provides access to all platform features, but its price is generally affordable only for large enterprises.
In summary: which tool to choose between Mixpanel and Amplitude?
Mixpanel stands out for its user-friendly interface and powerful product marketing tools. Amplitude excels in advanced user behavior analysis with detailed segmentation features and extensive data integration capabilities.
The choice between Mixpanel and Amplitude is crucial and should be based on your organization’s specific needs. If you seek a user-friendly solution with excellent product marketing tools, Mixpanel might be your best ally. However, if you need advanced user behavior analysis and robust data integration capabilities, Amplitude could be the ideal solution. Check the detailed comparison table below to help you make an informed decision.
Criteria | Mixpanel | Amplitude |
|---|---|---|
Learning curve and accessibility | Mixpanel features a beginner-friendly interface, ideal for quickly understanding and validating Product Market Fit. | Amplitude requires more experience in data analysis, suitable for handling large data sets. |
Product Marketing | Mixpanel Marketing Analytics offers templates, cost-per-click analysis and acquisition channels. | Amplitude offers integration tools for marketing analysis, but focuses mainly on advanced behavioral analysis. |
User behavior and segmentation | Mixpanel offers basic segmentation and behavior analysis functionalities. | Amplitude offers an advanced segmentation and user behavior analysis system. The software enables session replay, AI-generated predictive cohorts, and detailed comparison of KPIs by cohort. |
Data hygiene | Mixpanel offers basic data management functions, but is less advanced than Amplitude. | Amplitude's “Govern” module is ideal for real-time management of the tagging plan, ensuring data cleanliness and accuracy. |
Unique features | Mixpanel features a “Find interesting segments” function to automatically identify significant segments. The software also features a “Signal” function to identify key actions leading to user retention. | Amplitude enables event streaming to third-party services, as well as detailed filtering of events, users and properties. The tool also provides an SDK for Unreal Engine. |
Free plans | Mixpanel offers free access to 100,000 users per month, each of whom can generate up to 1,000 events, for a total of 100 million events per month. | With its free plan, Amplitude tracks up to 10 million events per month. |
Paid plans | Mixpanel stands out for its customizable growth plans: you can benefit from a basic plan starting at $25/year for 1,000 users, and an enterprise plan starting at $2,000/month. | Amplitude offers a Growth Plan for around $1,500/month, with no event tracking limitations. The tool also offers an Enterprise Plan (generally more expensive) with all the solution's features. |
SDKs | Mixpanel provides SDKs for various platforms (iOS, Android, JavaScript), enabling easy integration of analysis into applications. | Amplitude provides an SDK for Unreal Engine, user action and context tracking, event logging, revenue tracking and more. |
Conclusion
Mixpanel and Amplitude are both high-quality tools. To choose the one that suits you best, it's crucial to determine your organization’s priorities and identify the software that meets your needs.
Several criteria must be considered:
The level of detail desired in your analyses
The amount of data and number of users to manage
Your requirements for analyses in relation to your user base
Your current level (beginner, intermediate, advanced)
The number of events you want to track, whether free or paid
Your expectations for the insights you wish to obtain
It's important to note that neither tool is objectively "better" than the other. The choice between Amplitude and Mixpanel depends on your specific needs, budget, the size of your user base, and your level of technical expertise.
